California Wildfires Data Exploration and Modeling
Tiffany Tan
Motivation:
I gained the idea for this project because I live in Northern California, which has been plagued by wildfires every summer for the past several years. Through this data exploration and analysis, I am hoping to find out more about the causes, severity, and other factors concerning these fires. I am curious to see if there is some special factor that causes more fires in some years than others, and hope to discover more about the cause and effect as well. I have obtained my data from Kaggle as well as a Github repository that I found where some data visualizations were created concerning wildfires in the US.
Methods and Findings:
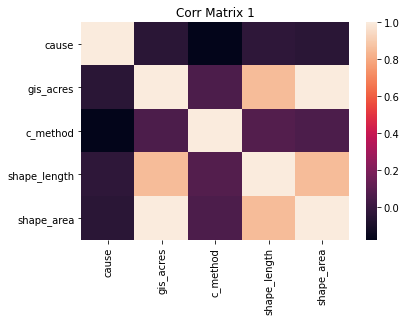
So far, for my first dataset, I have cleaned up the data by removing all the unnecessary columns (such as comments). I have created a few visuals like a correlation matrix and some bar graphs. But in doing so, I realized I didn't have data that gave me a good estimation of wildfire severity, so I found a second dataset that I have begun cleaning and exploring.
Data Visualizations:
Correlation Matrices:

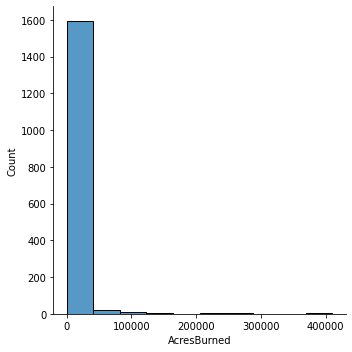
Acres Burned Distribution:
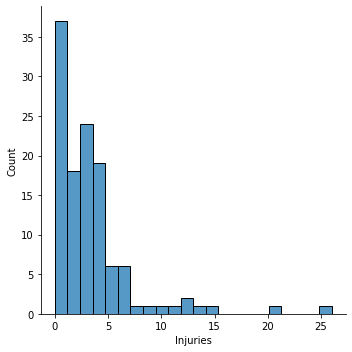
Injury Distribution:
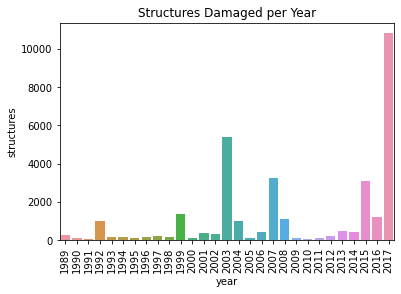
Structures Damaged per Year:
Cleaned Datasets:
https://docs.google.com/spreadsheets/d/1TGpSzRuodgJPqKuOdEiqg0-EOYB4Fb6NBSL2AkO5tQA/edit?usp=sharing
https://docs.google.com/spreadsheets/d/1fmUuh2e8-4xpa-TVr9iUOtnPmR6R3XU2ARLZ4weayQk/edit?usp=sharing
San Francisco 2020 After the Labor Day Fires Photo by Patrick Perkins on Unsplash